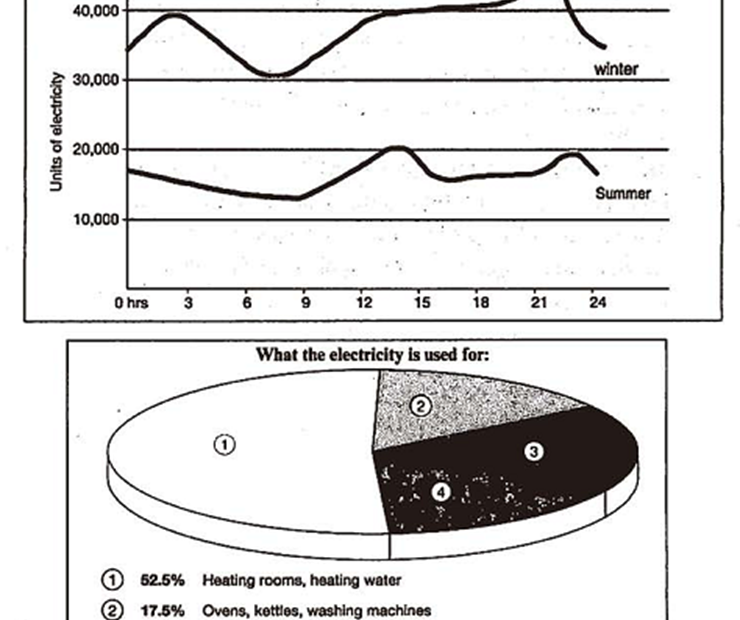
The graph below shows the demand for electricity in England during typical days in winter and summer. The pie chart shows how electricity is used in an average English home.

The graph below shows the demand for electricity in England during typical days in winter and summer. The pie chart shows how electricity is used in an average English home.