How coffee is produced and prepared for sale
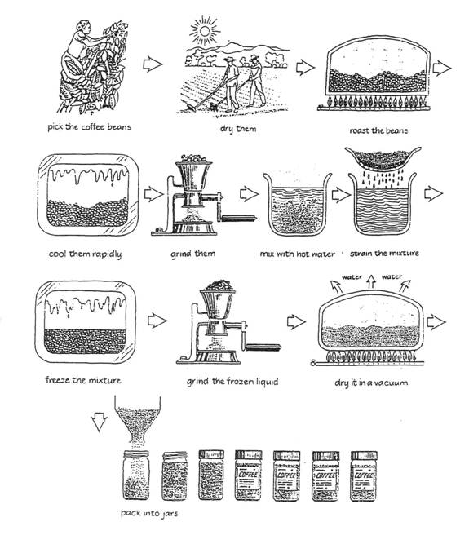
The diagram below shows how coffee is produced and prepared for sale in supermarkets and shops.
The diagram below shows how coffee is produced and prepared for sale in supermarkets and shops.
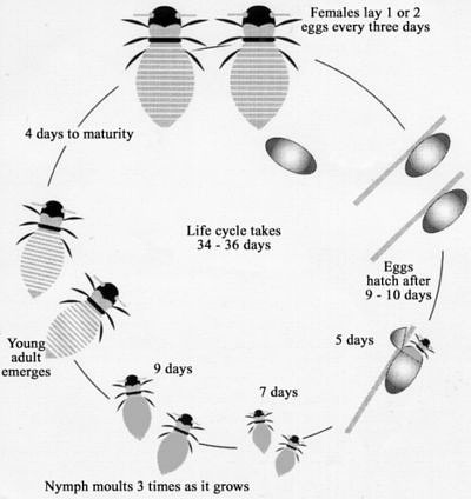
The diagram below shows the life cycle of the honey bee.

The three pie charts below show the changes in annual spending by a particular UK school in 1981, 1991 and 2001.
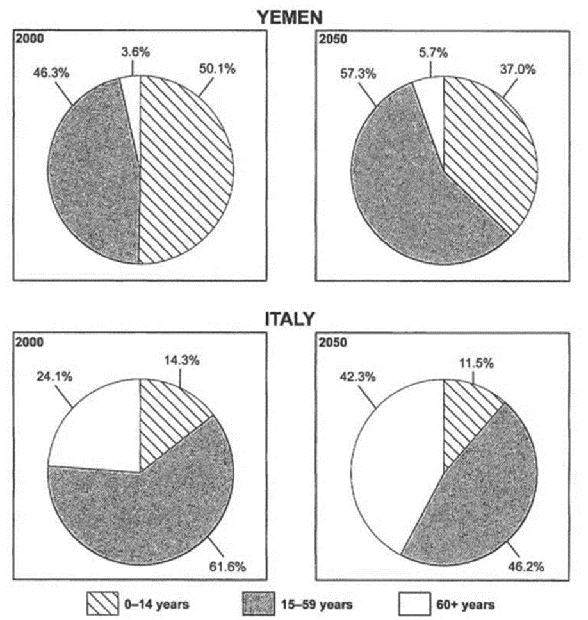
The charts below give information on the ages of the populations of Yemen and Italy in 2000 and projections for 2050.
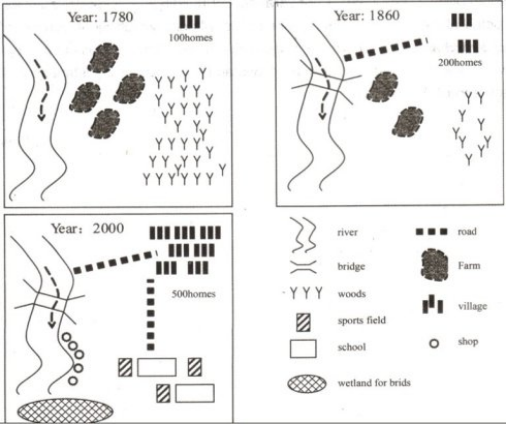
The diagram below shows the development of the village of Kelsby between 1780 and 2000.
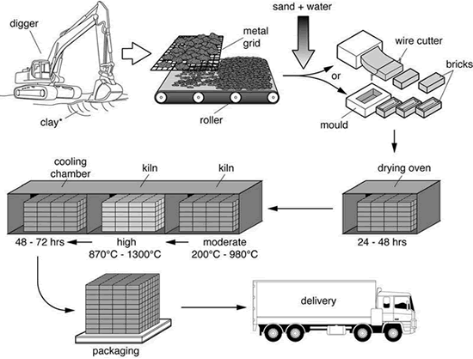
The diagram below shows the process by which bricks are manufactured for the building industry.
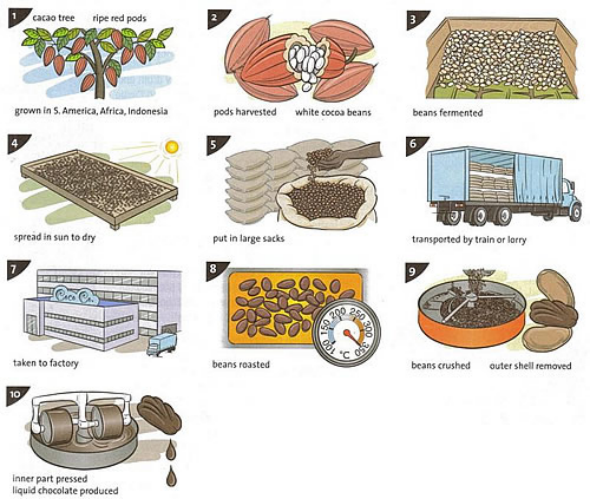
The illustrations below show how chocolate is produced.

The graph below shows the consumption of fish and some different kinds of meat in a European country between 1979 and 2004.

The graph below shows the proportion of population aged 65 and over between 1940 and 2040 in three different countries.