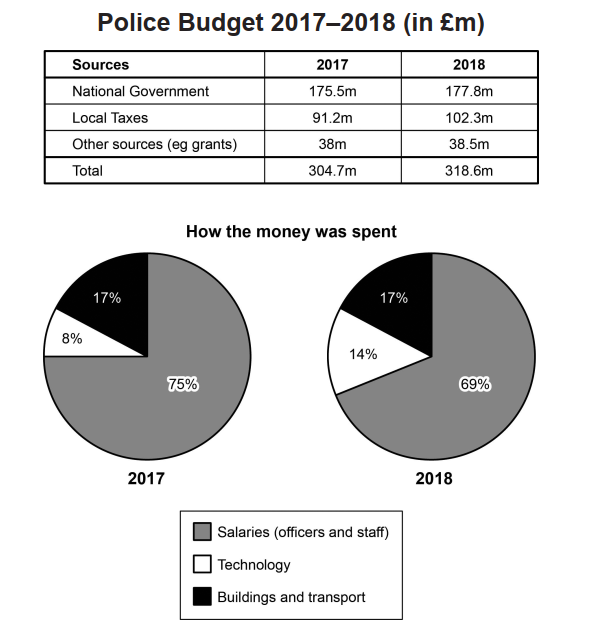
Skip to content
Home » Writing » Task 1 » Two charts

Two charts

The value of one country's exports

The value of one country’s exports

The chart below shows the value of one country’s exports in various categories during 2015 and 2016. The table shows the percentage change in each category of exports in 2016 compared with 2015.

Visitors to Ashdown Museum

The table below shows the numbers of visitors to Ashdown Museum during the year before and the year after it was refurbished. The charts show the result of surveys asking visitors how satisfied they were with their visit., during the same two periods.

Greenhouse gas emissions

Greenhouse gas emissions

The first chart below shows how energy is used in an average Australian household. The second chart shows the greenhouse gas emissions which result from this energy use.

Agricultural land

Agricultural land

The pie chart below shows the main reasons why agricultural land becomes less productive. The table shows how these causes affected three regions of the world during the 1990s.

en_GBEnglish